
Reporting
Reporting
The advanced Reporting feature available in the Odoo 16 Purchase module will give effective reports about the purchase operations done in your company. You can generate reports on a daily, monthly, or yearly basis and use them to analyze your purchase activities. The dynamic purchase reporting platform will help you to analyze data in graphical as well as pivot tables.
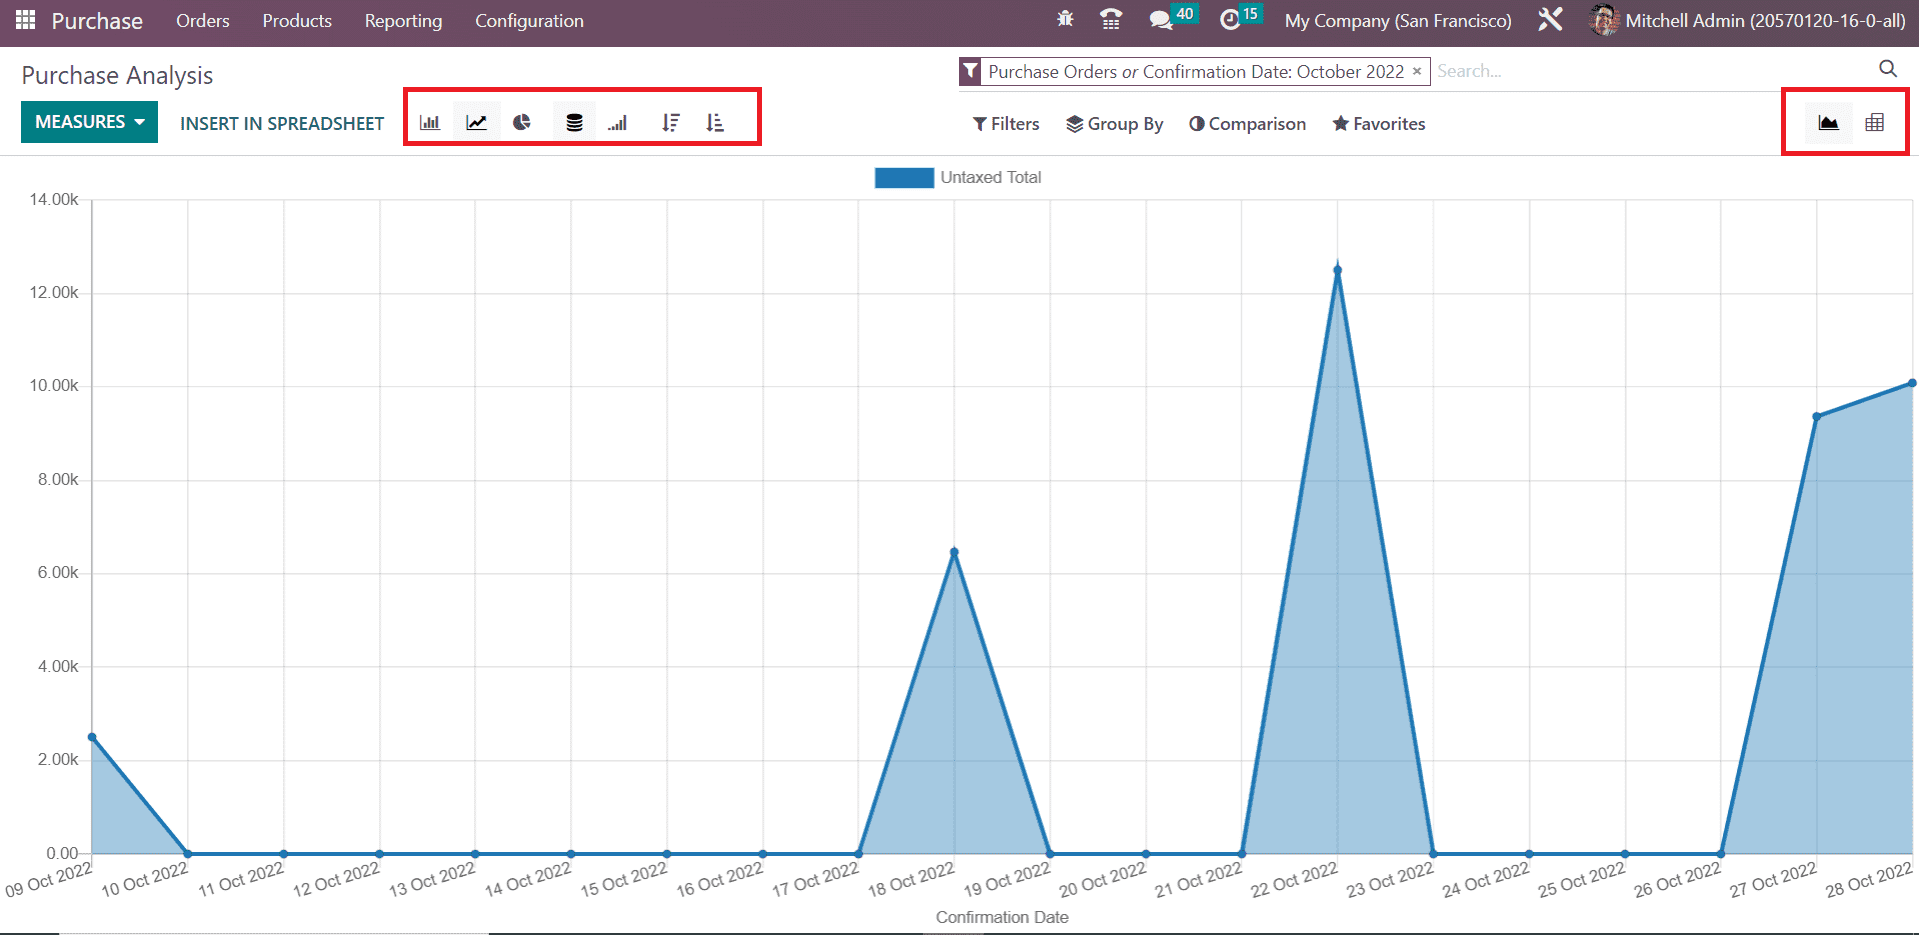
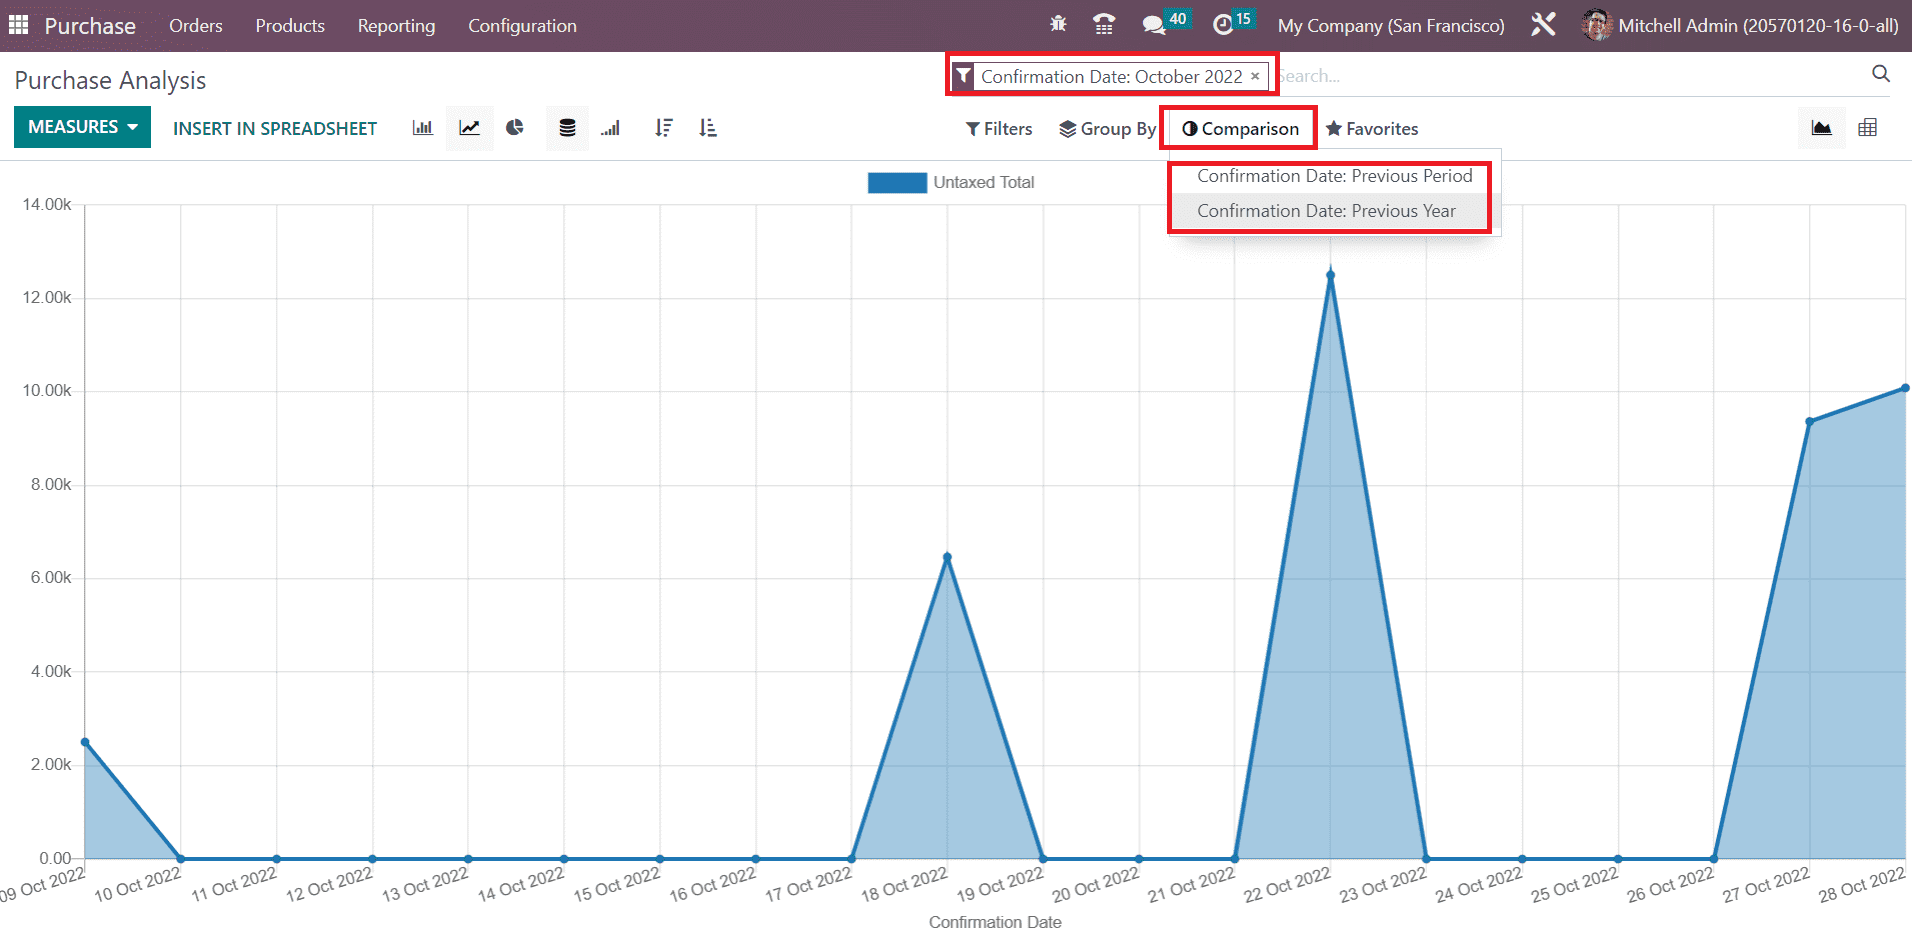
The screenshot shown above is the line chart of the Untaxed Total of the purchases based on their confirmation date. You can observe the Graphical reports in Line, Bar, and Pie Charts based on your convenience. The Line and Bar charts can be arranged in ascending or descending order.
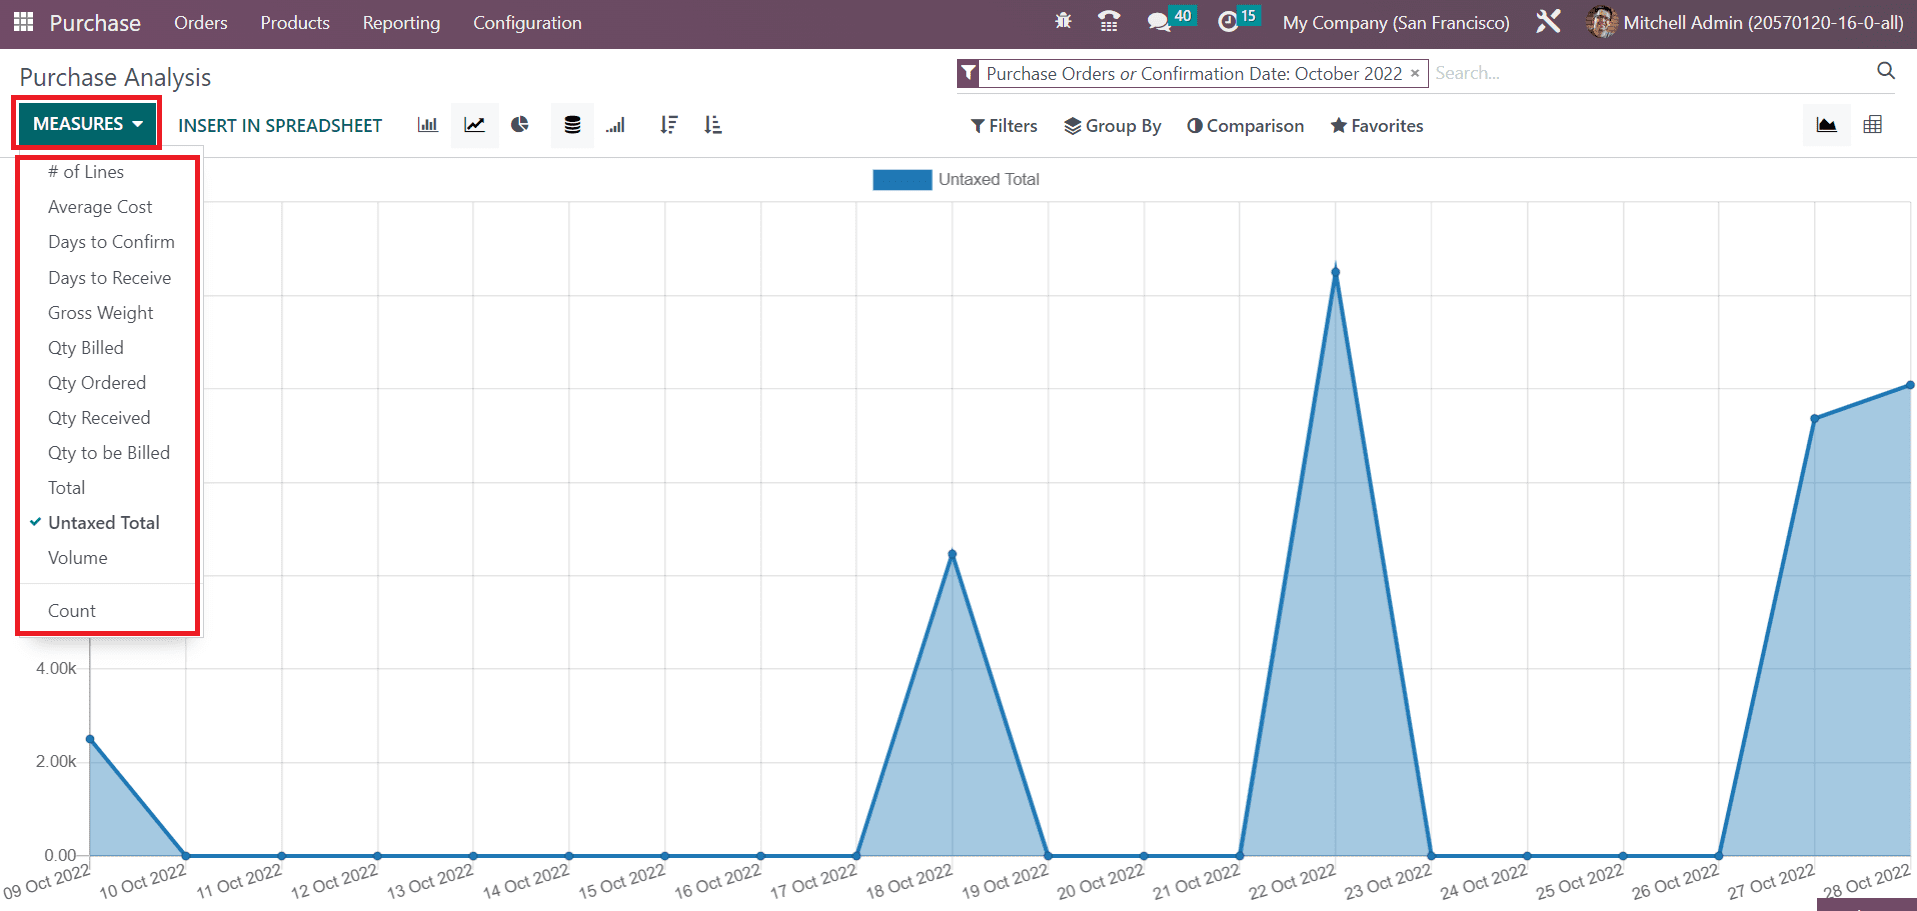
You can set the Measures as Average Cost, Days to Confirm, Days to Receive, Gross Weight, Quantity Billed, Quantity Ordered, Quantity Received, Quantity to be Billed, Total, Untaxed Total, Volume, and Count.
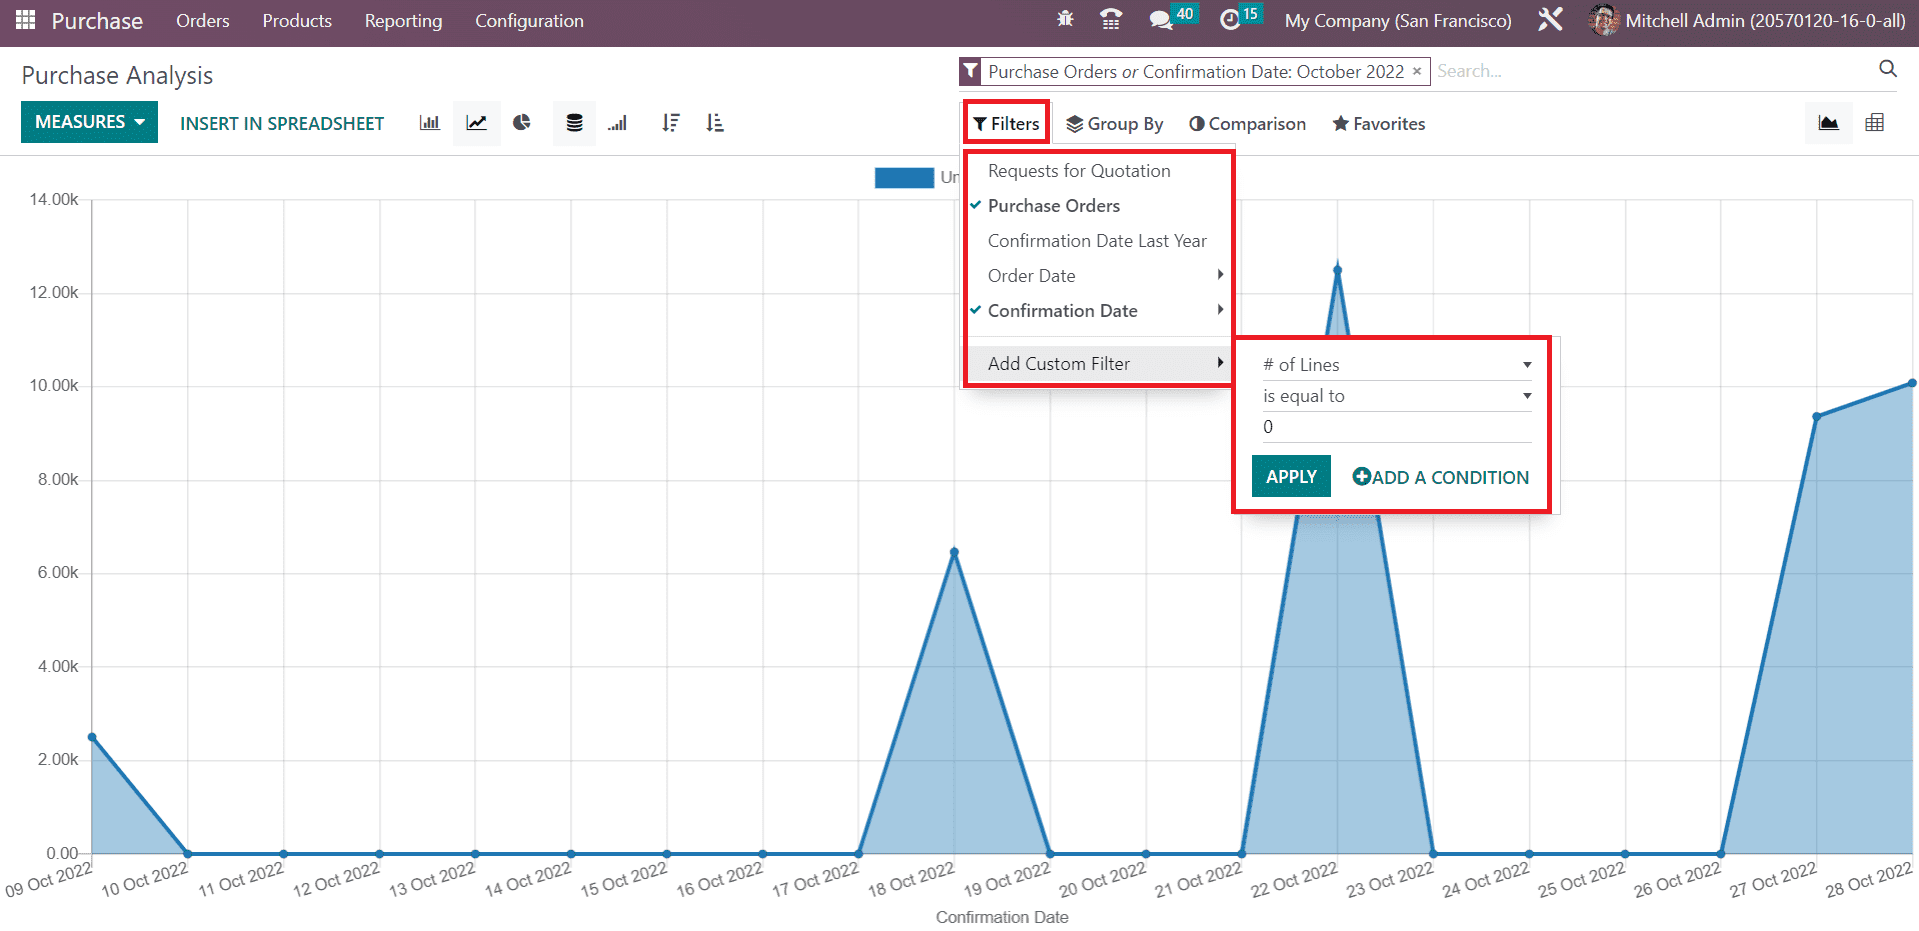
You can filter the report based on the Request for Quotations, Purchase Orders, Confirmation Date Last Year, Order Date, and Confirmation Date. Using the Add Custom Filter option, you can create new custom filters for your reports.
Similarly, you will get default Group By options also in the purchase reporting platform
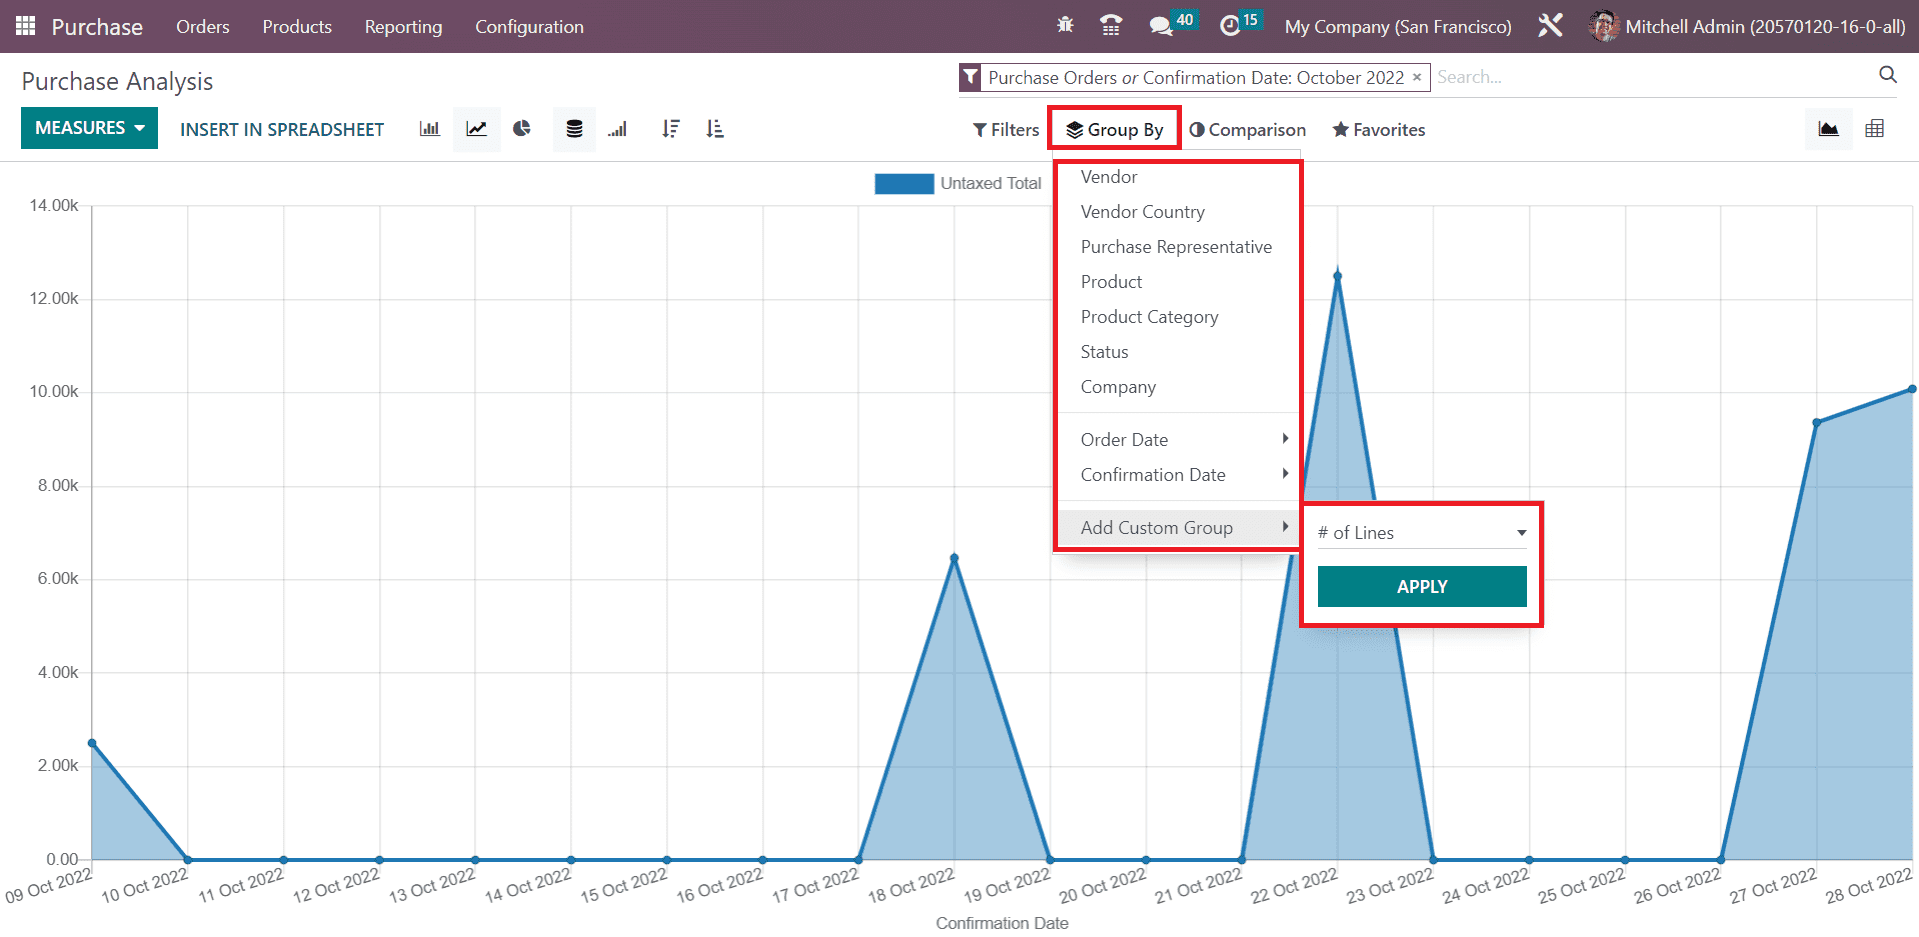
You can group the reports based on Vendor, Vendor Country, Purchase Representative, Product, Product Category, Status, Company, Order Date, and Confirmation Date. Use the Add Custom Group button to create custom group by options.
While using the filter Confirmation Date, you will get the Comparison option that helps you to compare the current report with previous period as well as year.
Now, let’s check the Pivot view of the Purchase report.
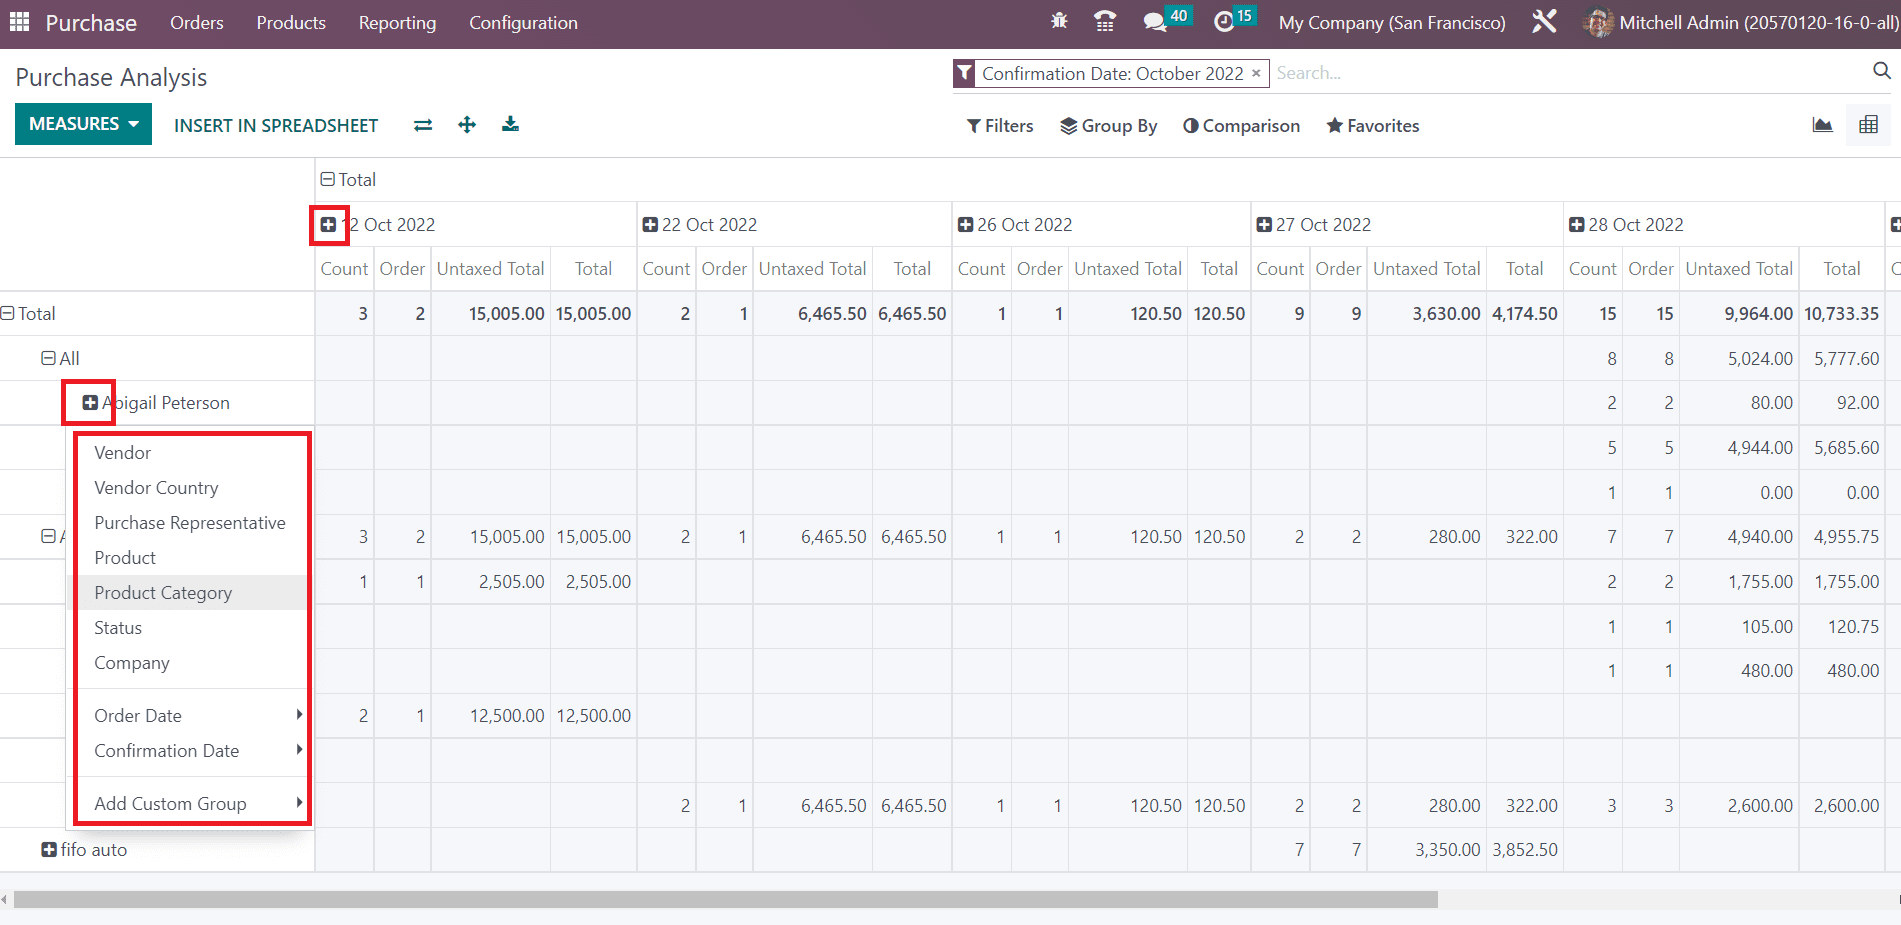
Using the small + icon will help you to expand the table with additional data. You can convert the report into a spreadsheet using the Insert Spreadsheet button. Based on your requirements, you can customize the purchase reports and analyze them without any confusion.
Last updated