
Reporting
Reporting
Proper monitoring of the inventory operations will help you to easily analyze and understand the workflow in managing the inventory. Odoo can offer you a dedicated platform especially for generating reports for the inventory operations done in your organization with an accurate representation of data in graphical and tabular views. You can customize your reports in real-time to get meticulous reports as per your requirements. In the Reporting menu of the Odoo Inventory module, you will be able to get the reports of Stocks, Locations, Moves History, Stock Moves, Valuation, and Performance. Let’s take a look at each of these reporting platforms in detail.
Stocks
The Stocks platform in the Reporting menu will give a list view of all stocks available in your inventory. You will get the details of the Product, Unit Cost, Total Value, On Hand, Free to Use, Incoming, and Outgoing quantity.
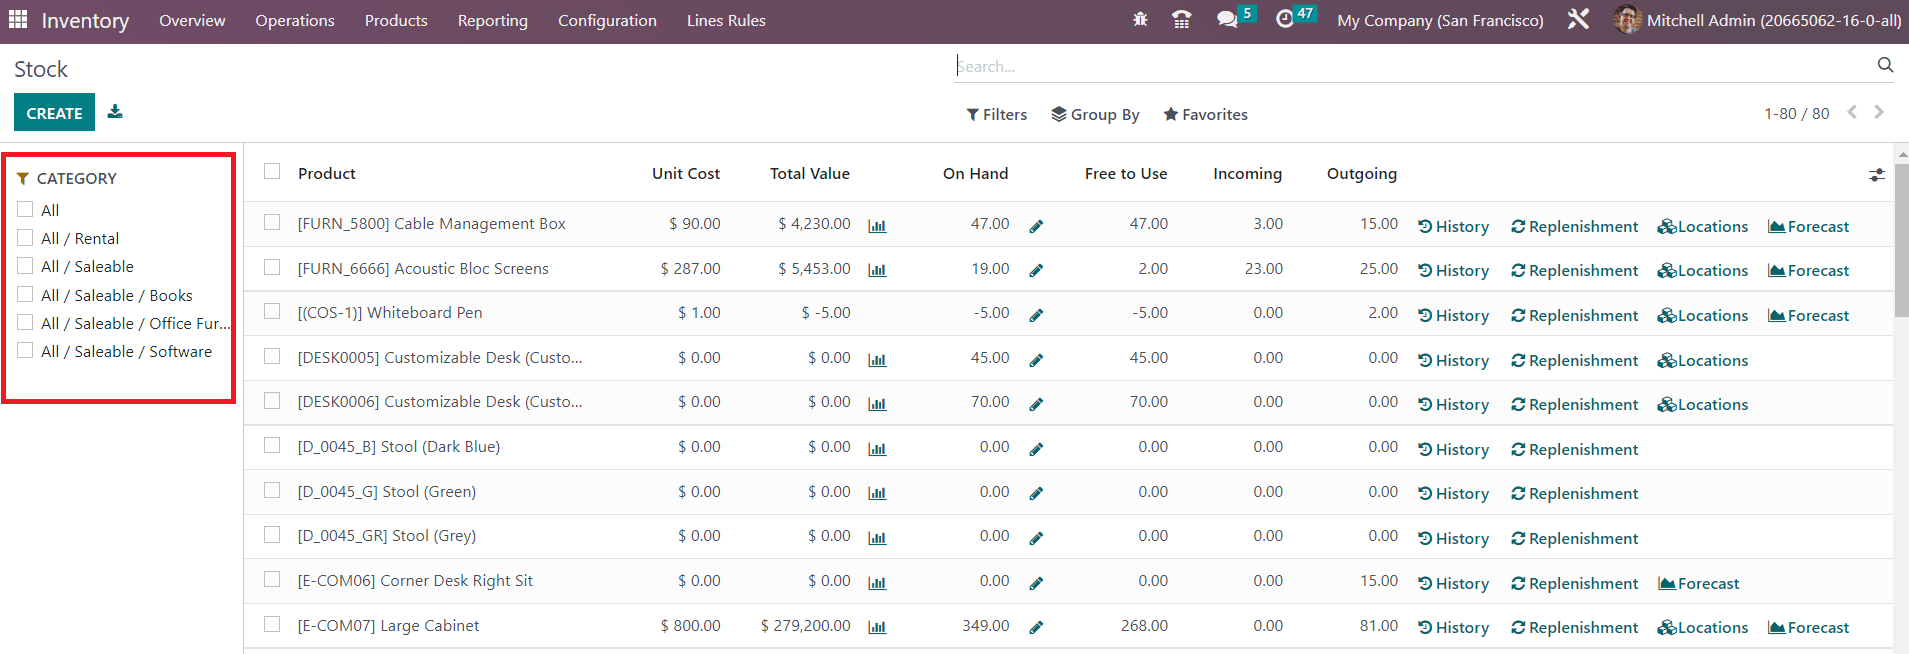
You can categorize the stock list based on the product category using the available categories shown on the left side of the screen as highlighted in the image. In order to simplify the search process, you can use the search bar at any time. The stocks can be filtered as Services, Products, Published, Available in PoS, Can be Sold, Can be Purchased, Can be Recurring, Can be Rented, Can be Subcontracted, Can be Expensed, Favorites, Warnings, Archived, Available products, and Negative Forecasted Quantity using the default Filters. You can create custom filters with assistance of the Add Custom Filter button. You will get Product Type, Product Category, and PoS Product Category as the default Group By option. Make use of the Add Custom Group button in order to create a custom group by option.
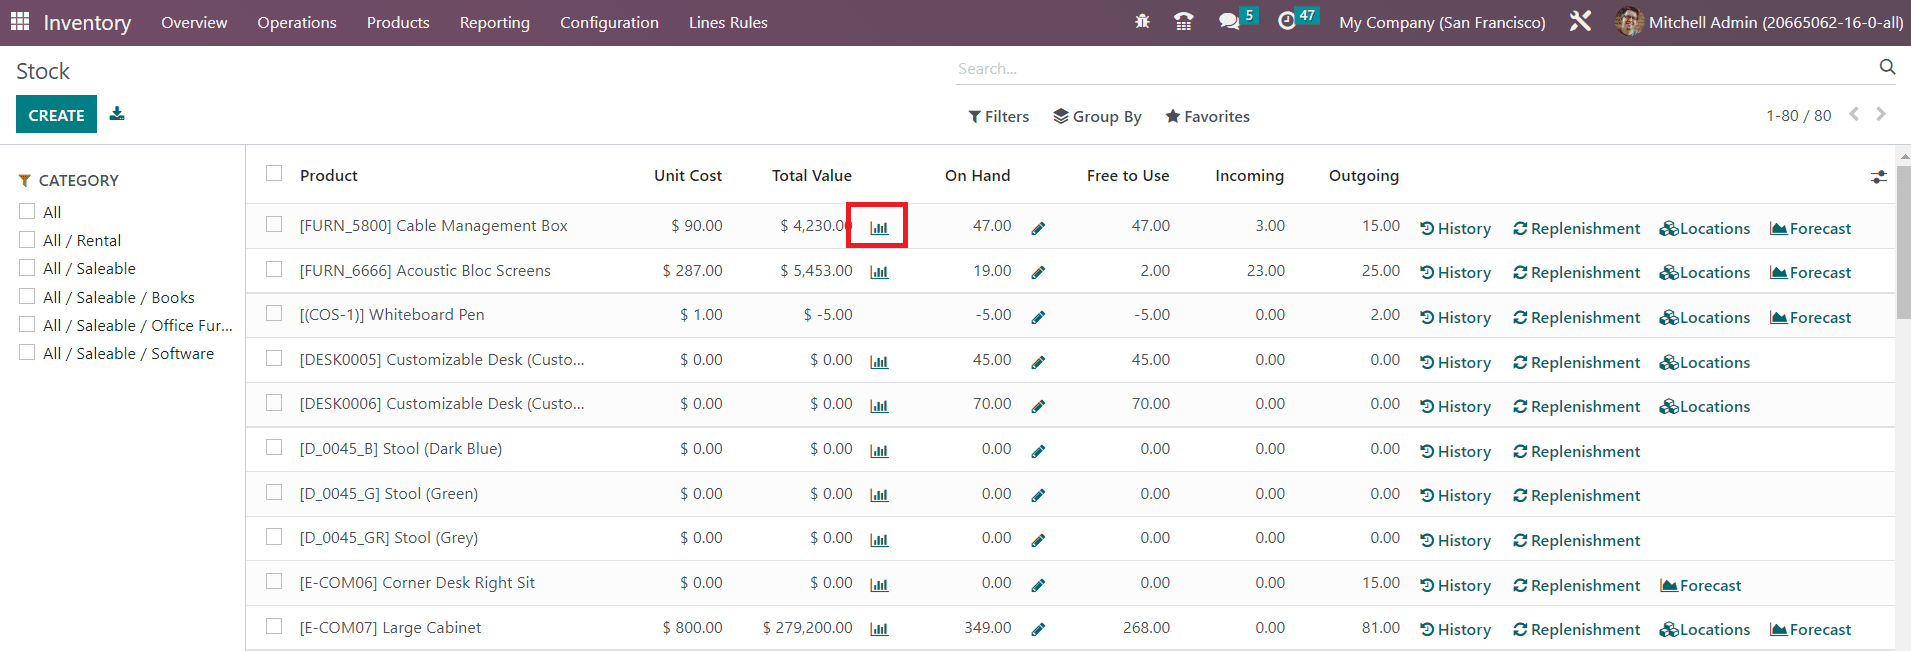
By clicking on the icon given near the Total Value field, you will get the Stock Valuation Report of the individual products.
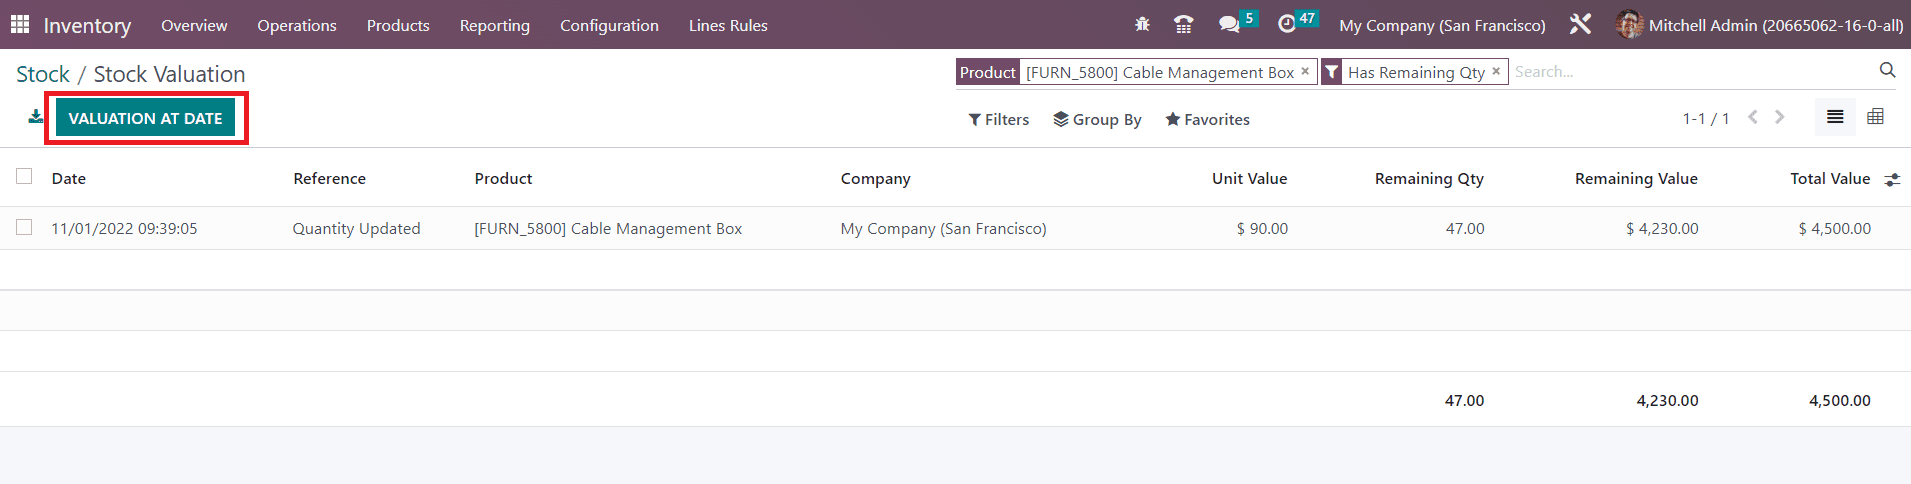
The stock valuation report of a product will show the valuation Date, Reference, Product, Company, Unit Value, Remaining Quantity, Remaining Value, and Total Value. If you want to get the stock valuation report of the product on a particular date, you can click on the Valuation at Date button. A pop-up window will appear asking you to choose a date to get the valuation report at that date.
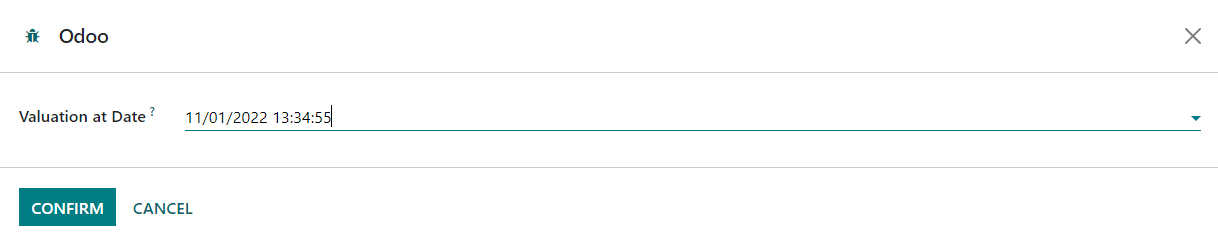
You can mention the date and click the Confirm button. Odoo will show you the stock valuation report of the selected date on your screen.
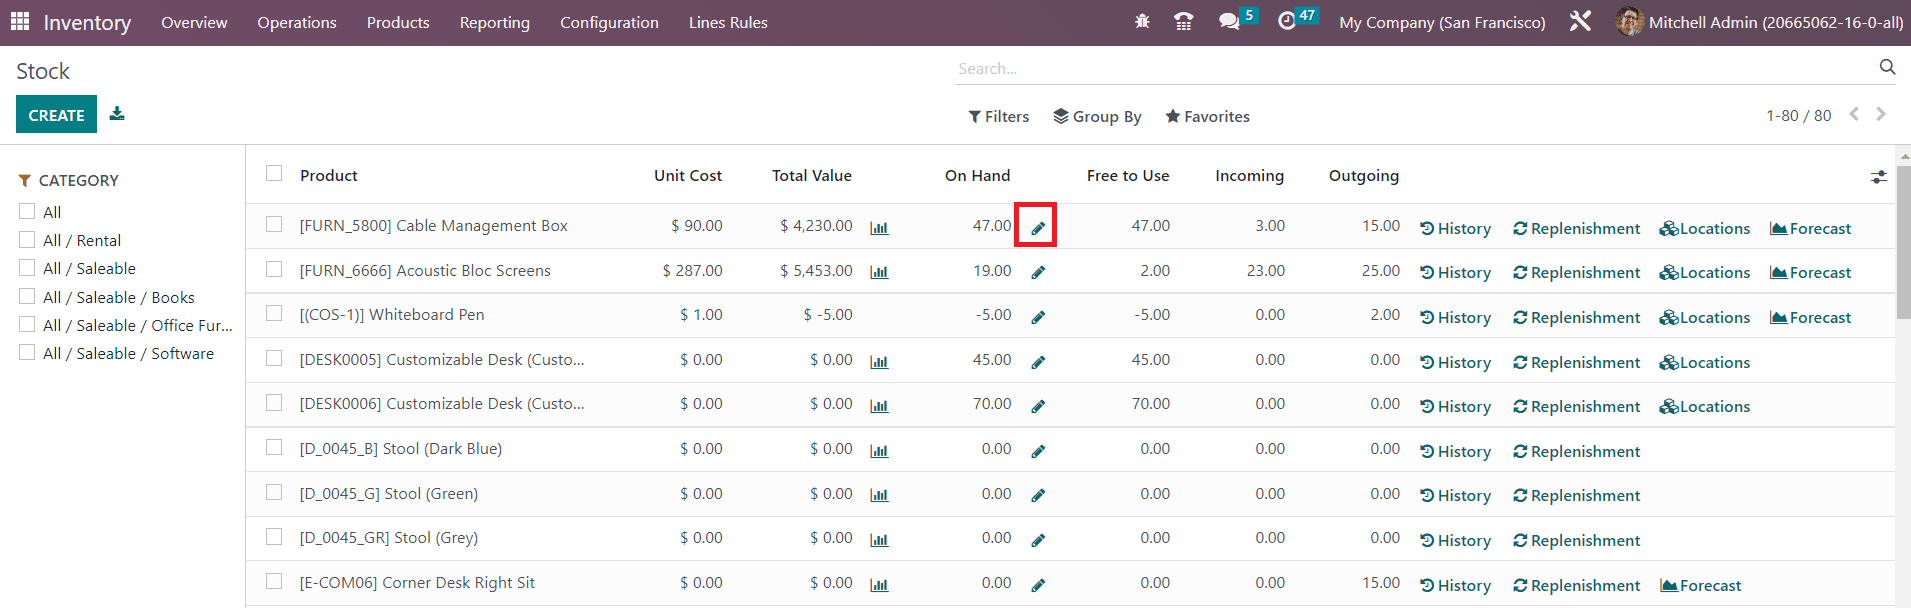
Clicking on the small icon shown next to the On Hand field will give you the Inventory Adjustment details of the product.
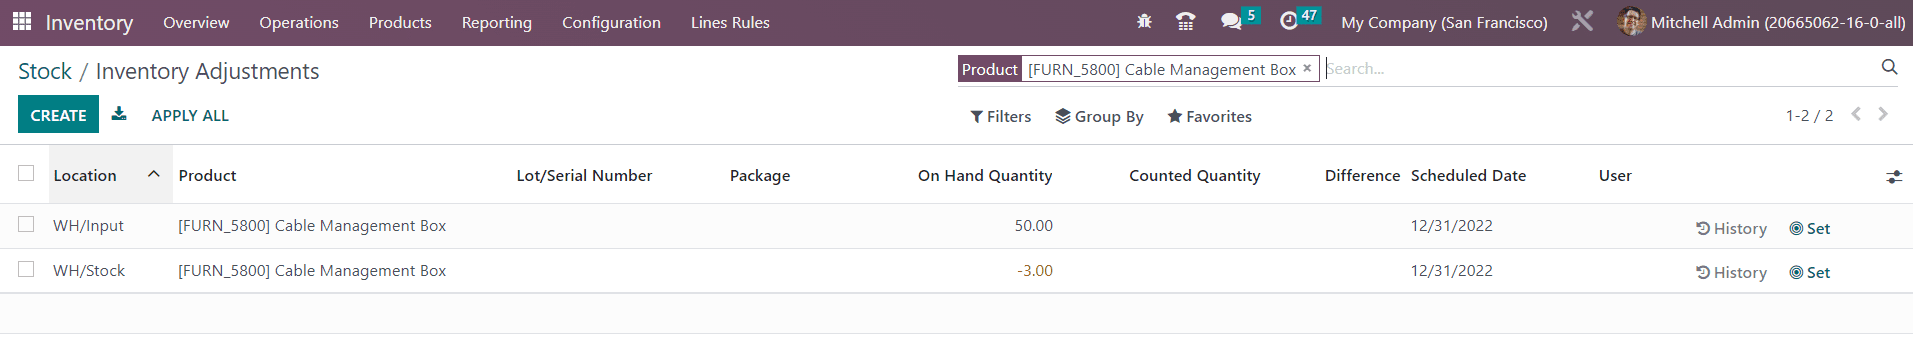
The working of the inventory adjustment platform is already discussed in the Inventory Adjustment section in this chapter.
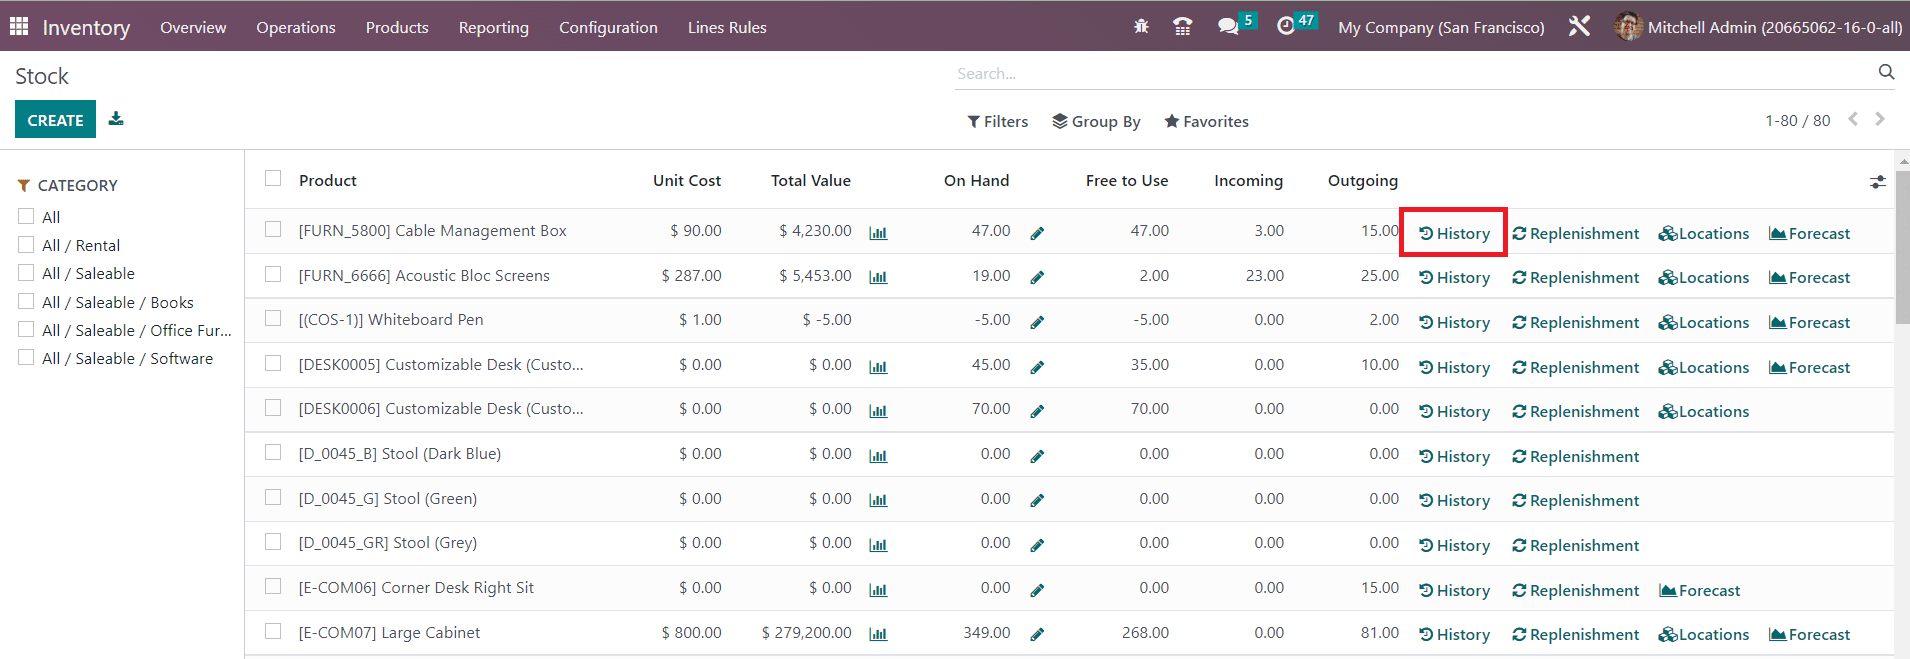
If you want to get the moves history of any product, you can click on the History button given in the stock window as shown in the image. This will lead you to the moves history window of the respective product.
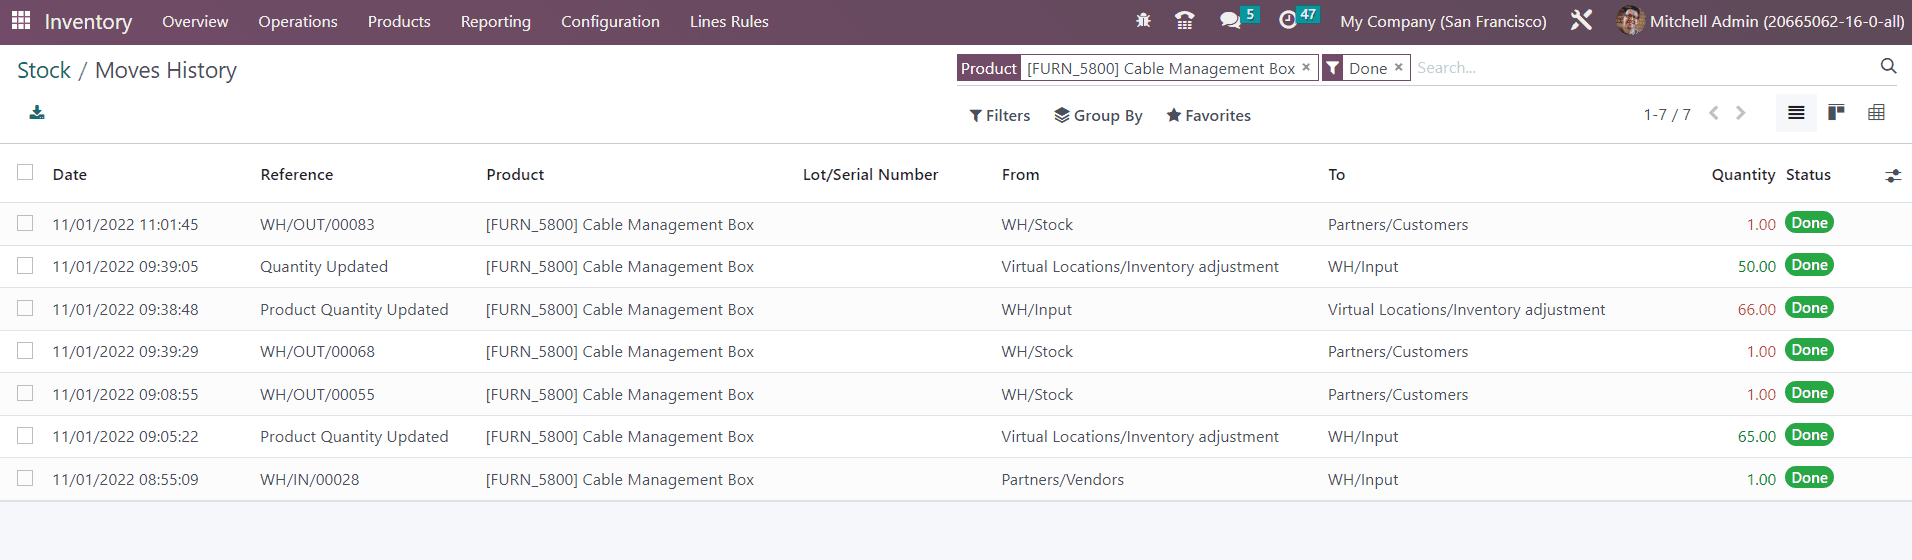
You can observe the Date, Reference, Product, Lot/Serial Number, From, To, Quantity, and Status of each move on this platform.
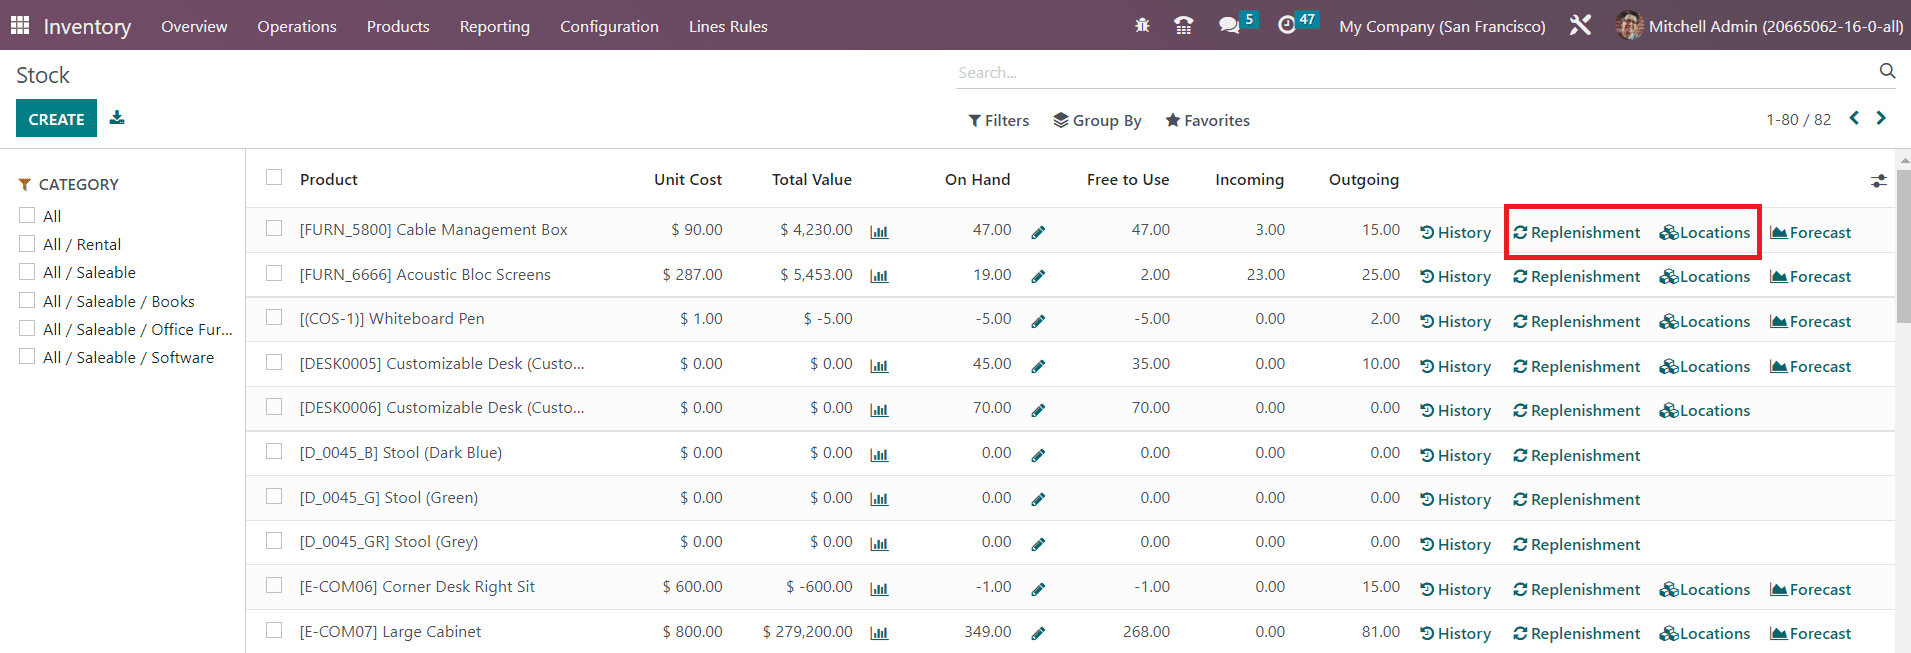
The Replenishment button available on the screen can be used to replenish the product based on reordering rules. The Location button will show the locations of a product in your inventory.
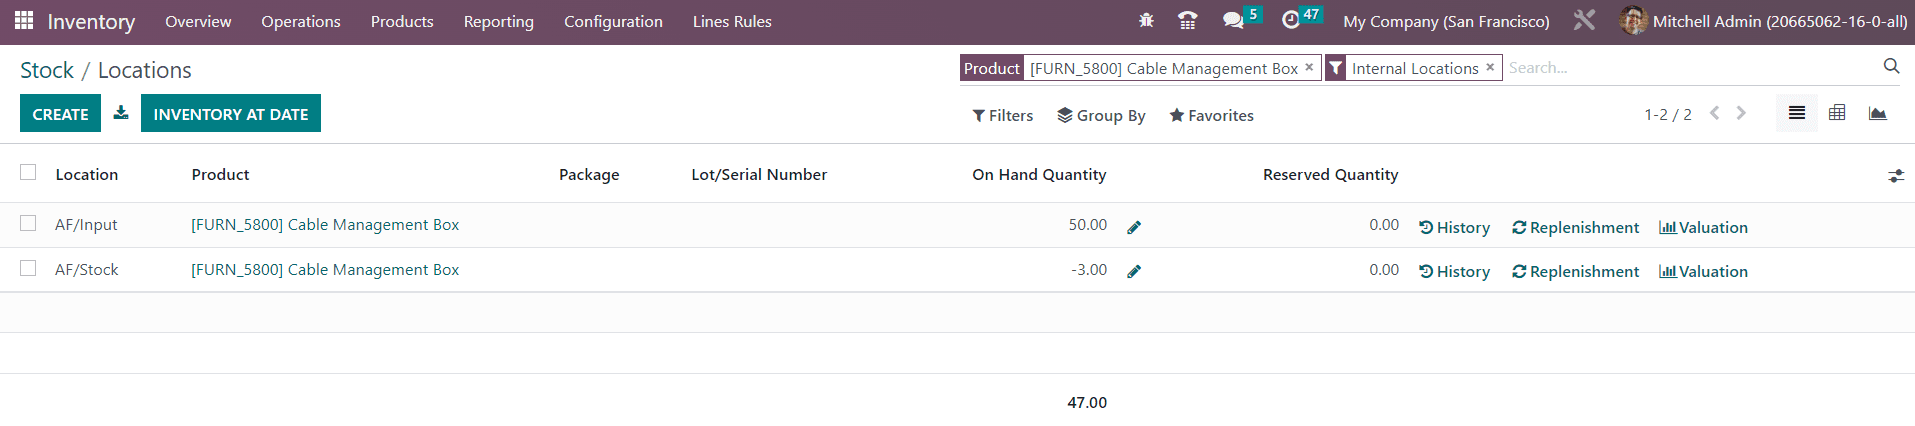
You can create a new location history directly from this window using the Create button. This platform shows the Location, Product, Package, Lot/Serial Number, On Hand Quantity, and Reserved Quantity. You will get the History button to observe the products' moves, the Replenishment button to replenish the product, and the Valuation button to analyze the stock valuation in a particular location.
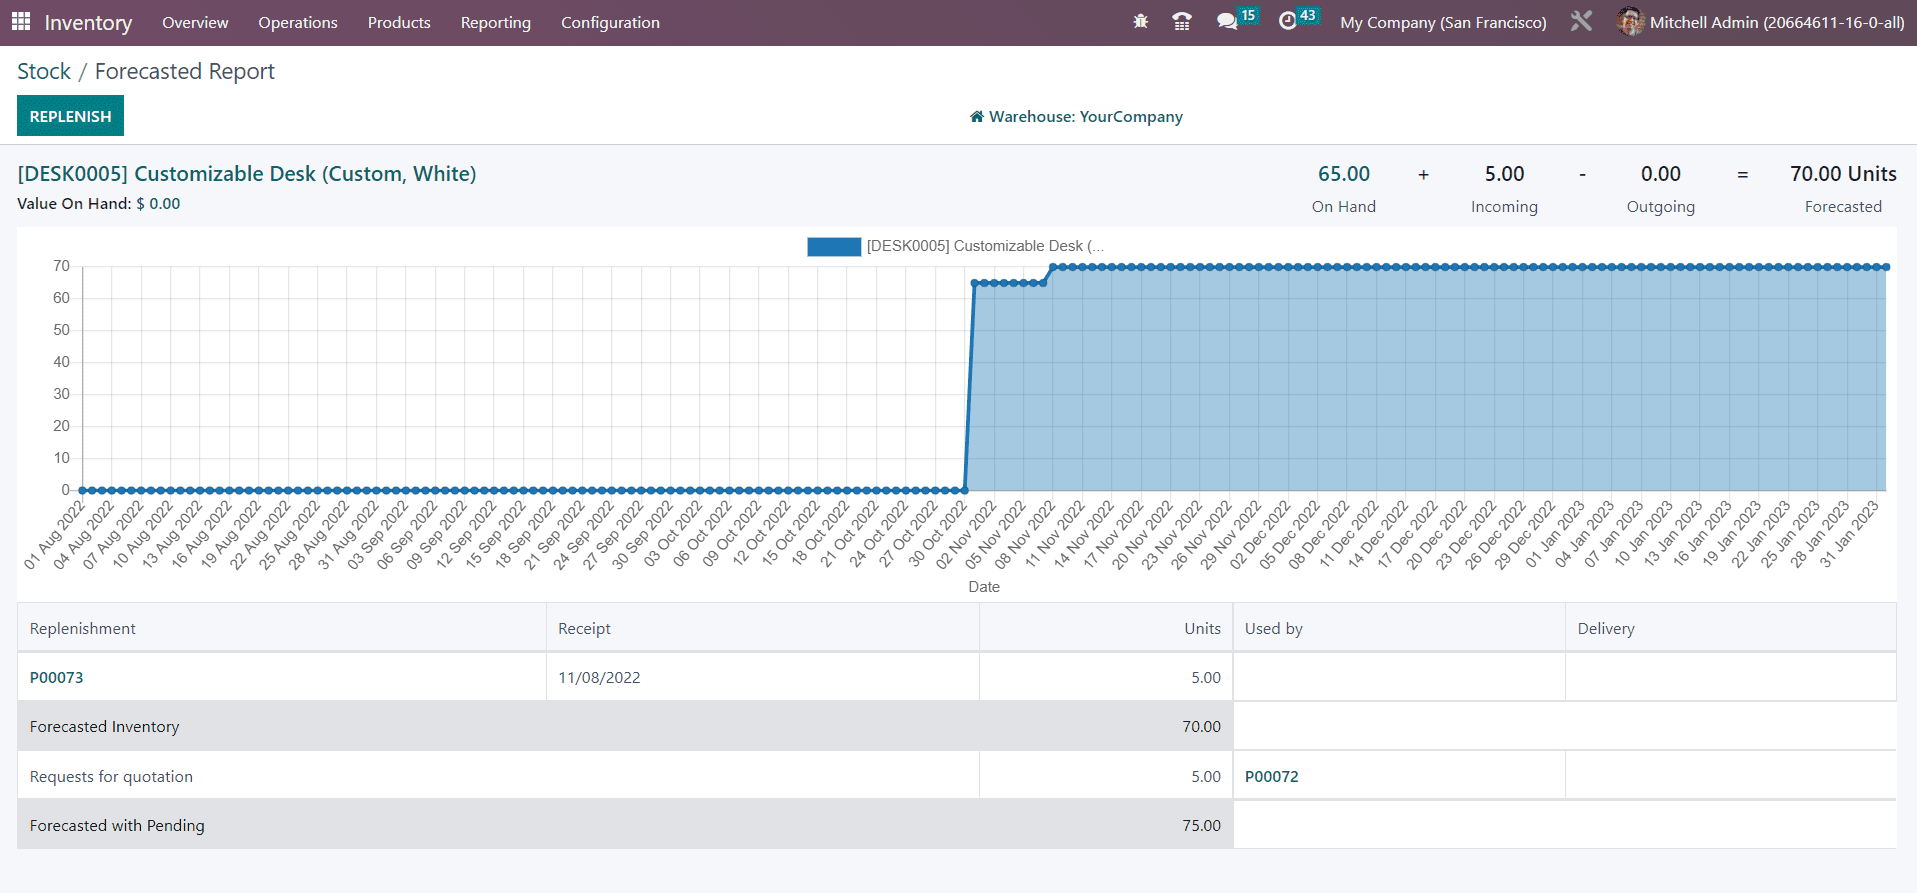
The Forcast button will help you to get the forecast report of a product.
Location
The list view of the Location report is given below. You can see the Location, Product, package, Lot/Serial Number, On Hand Quantity, and Reserved Quantity here.
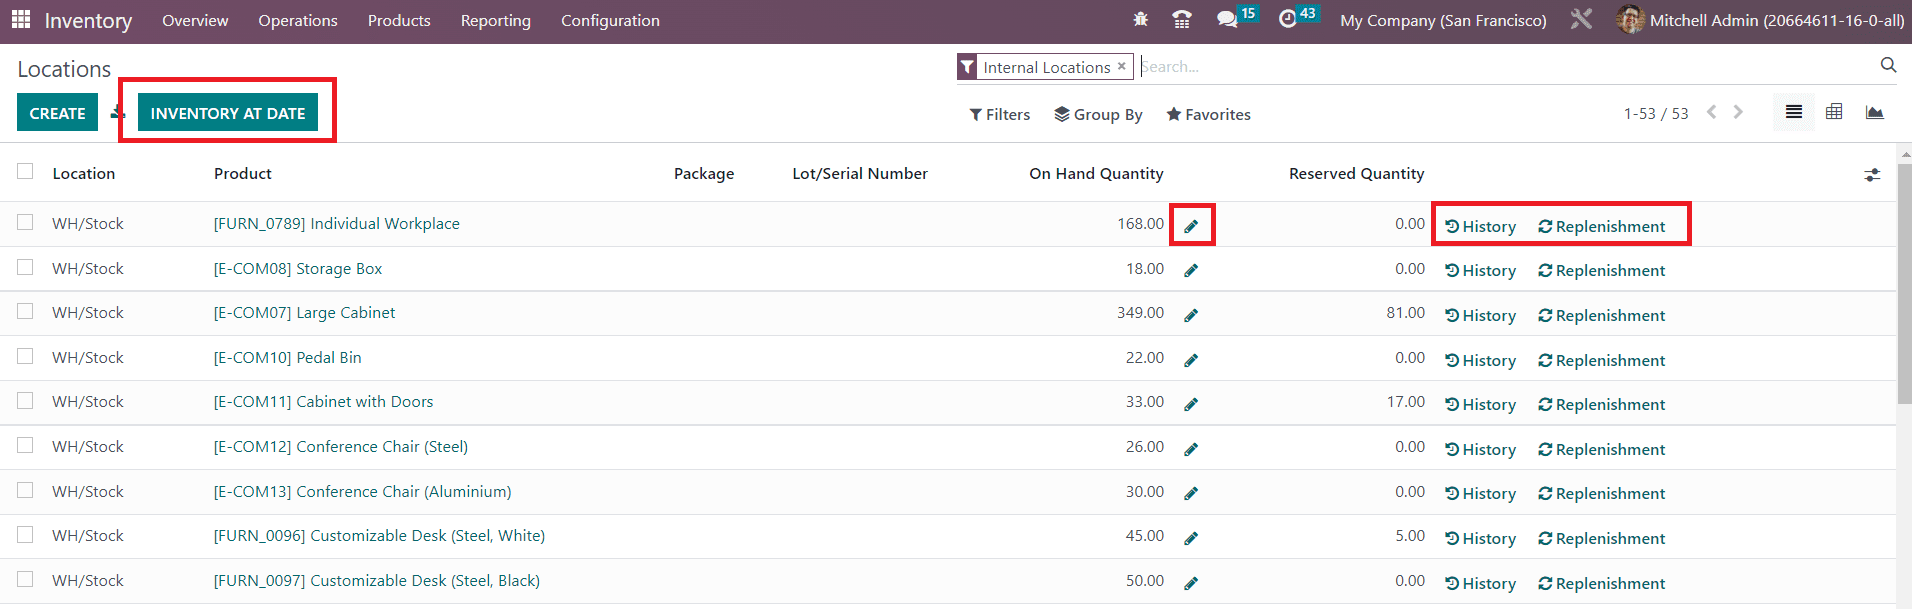
As we mentioned earlier, from the Location reporting window, you can observe the history of the moves using the History button and replenish the products using the Replenishment button. The inventory adjustment can be performed using the smart button available on the screen.
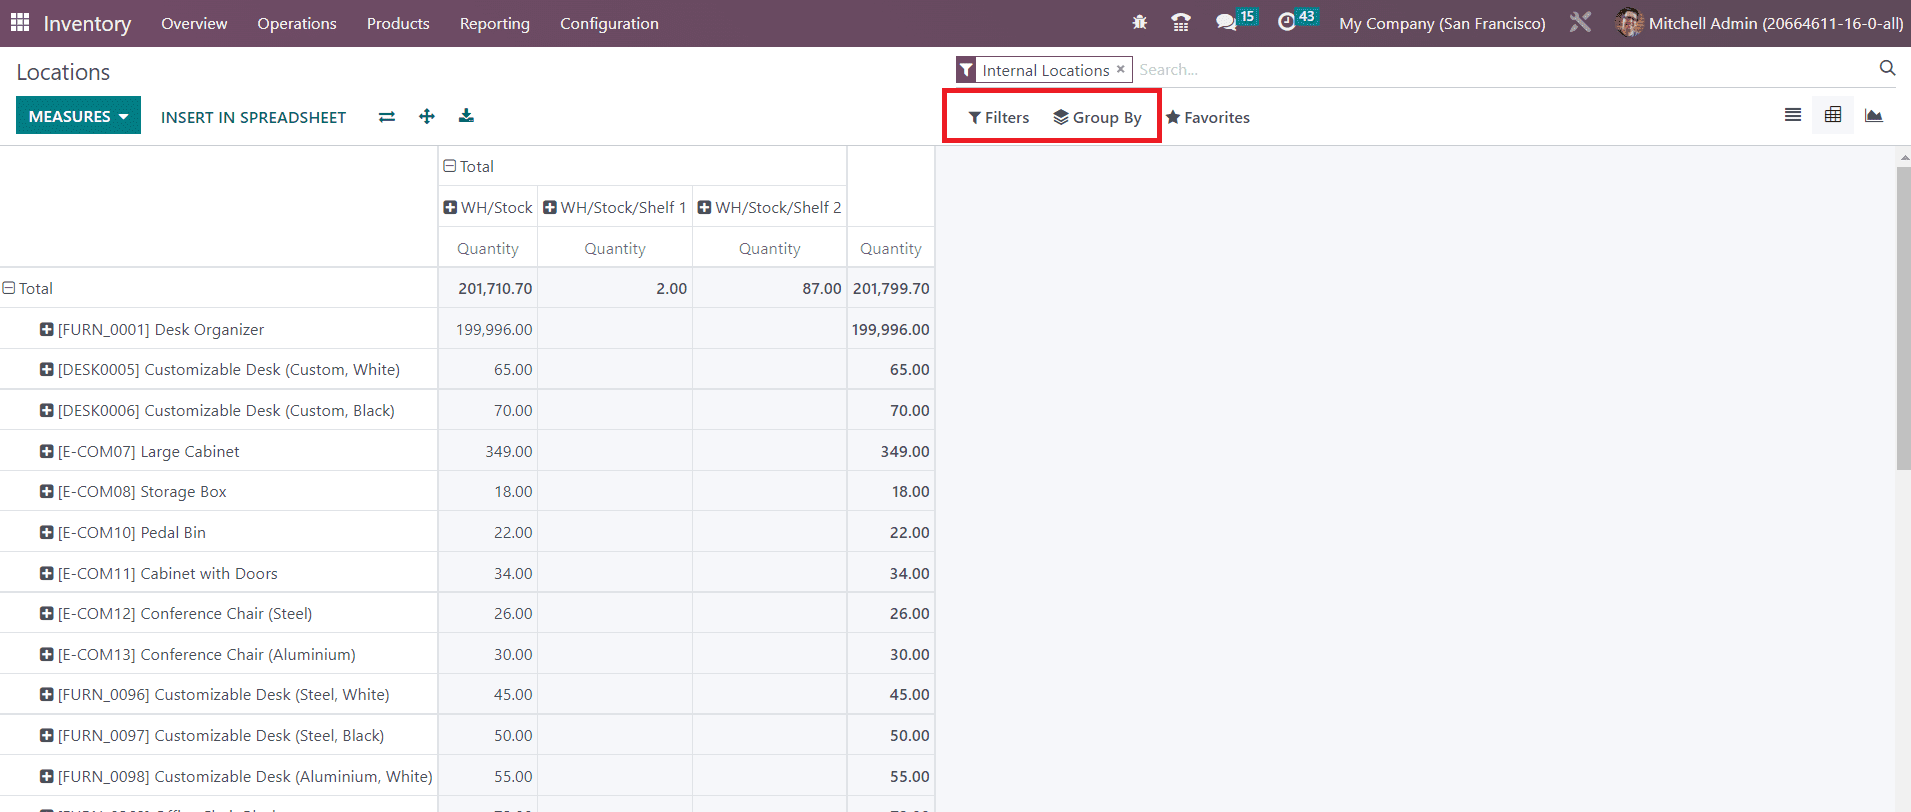
This screenshot shows the pivot table view of the Locations. You can use the Measures, Filters, and Group By options to generate suitable reports according to your demands. This window can be altered into a graphical view also where you can shift the graph between line, pie, and bar charts based on your convenience.
Moves History
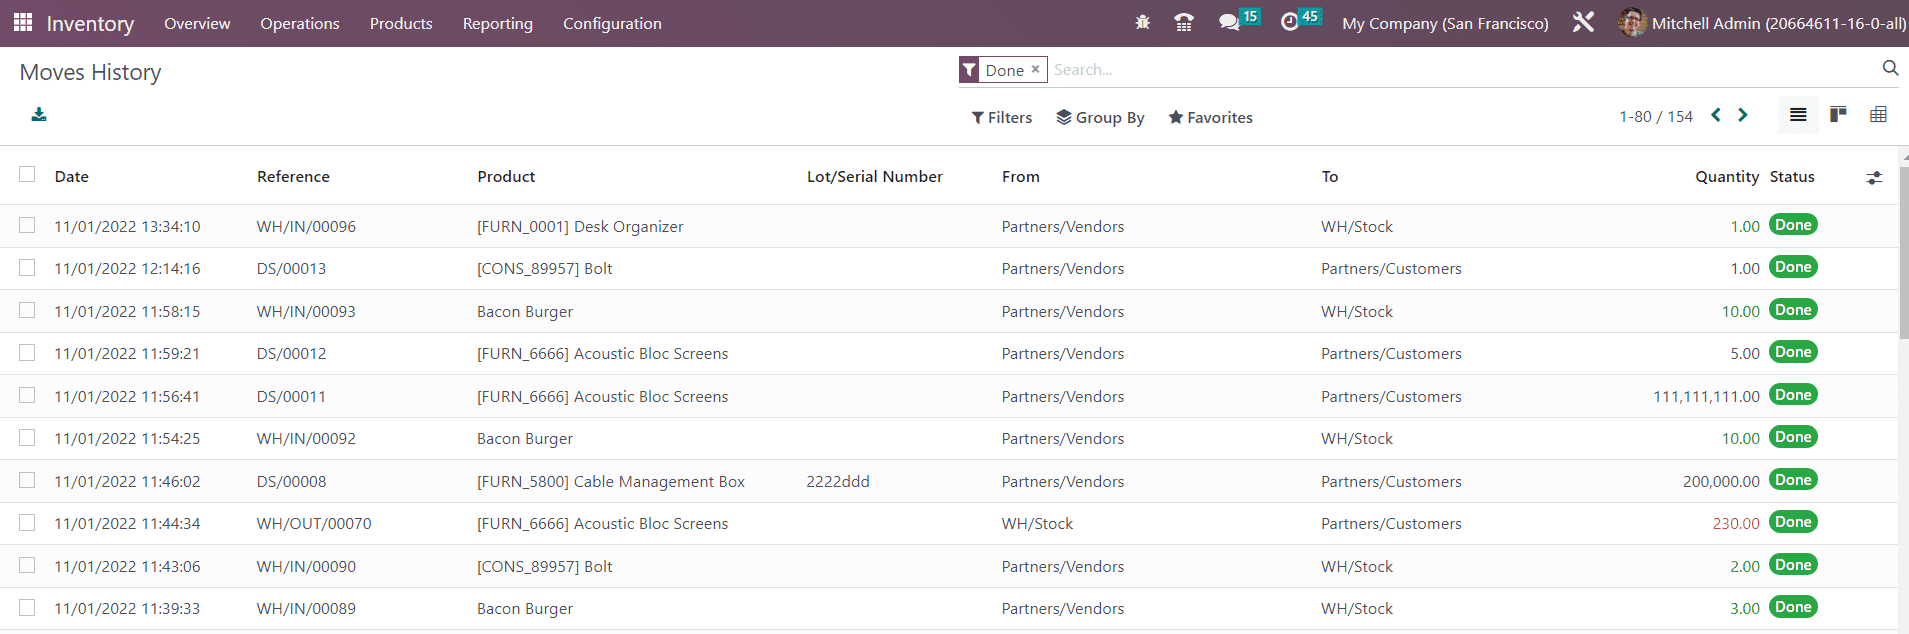
Odoo offers a separate platform to observe the moves history of all products recorded in your inventory. This report will give you a clear idea about the movement of products in your inventory on a particular date.
Along with the date of operation, you will get the Reference, Product, Lot/Serial Number, From, To, Quantity, and Status from the list view of the platform. It also provides options to observe the history of moves in Pivot as well as Kanban views.
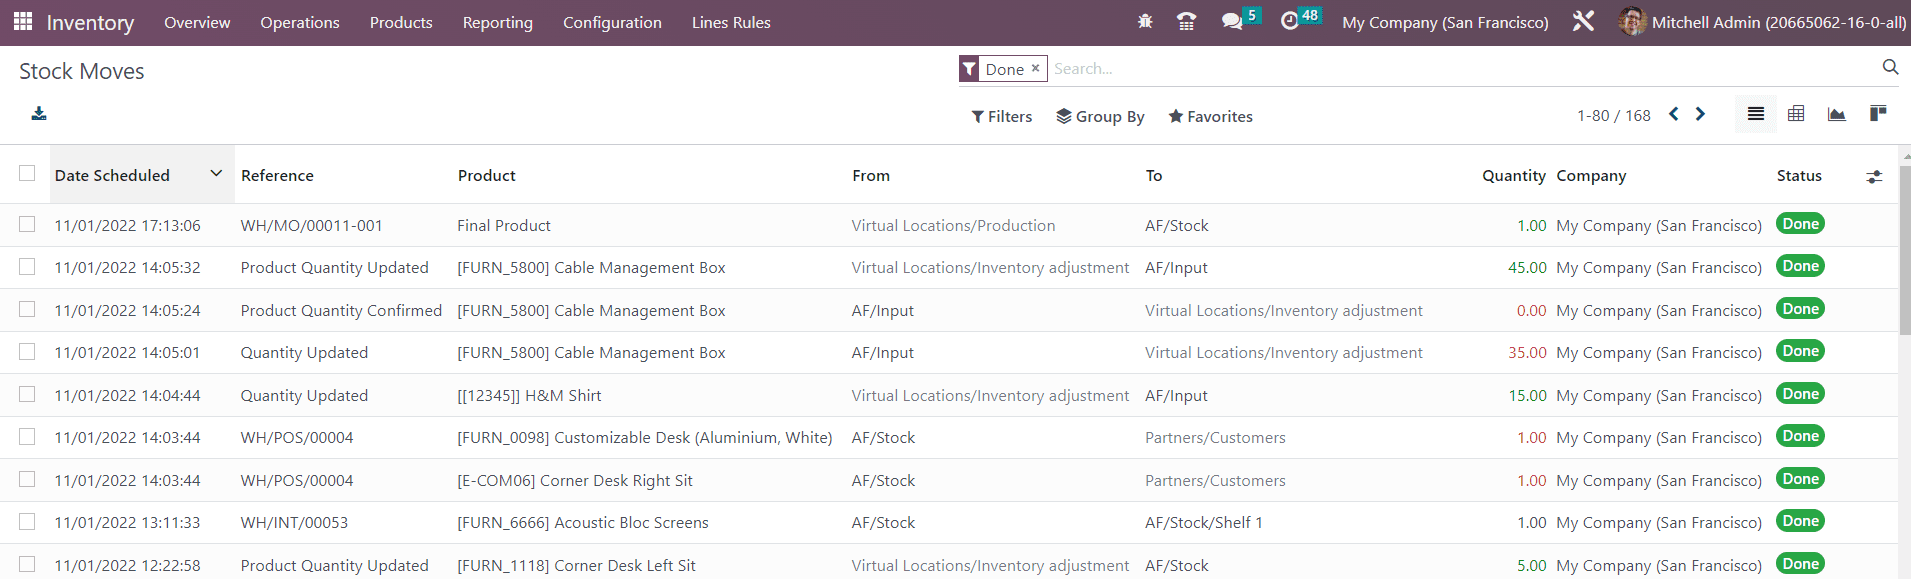
The Stock Moves platform in the Reporting menu will show the report of all scheduled stock moves in your inventory.
Stock Valuation
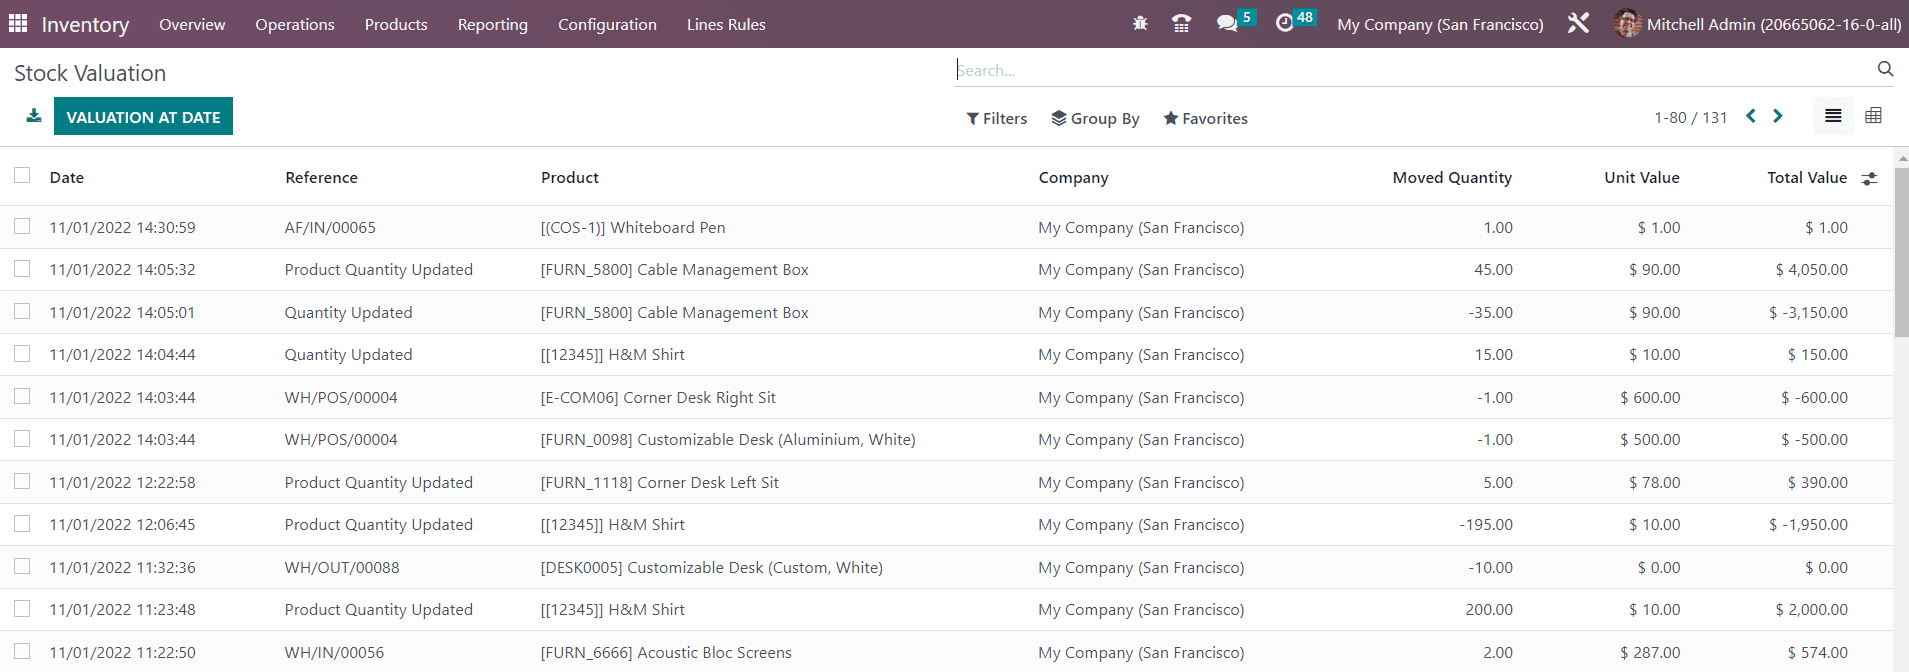
The stock valuation reports can be generated with the help of the Valuation option available in the Reporting menu of the Inventory module. You can effectively analyze stock valuation using this report.
From the list view of this platform, you will get the Date, Reference, Product, Company, Moved Quantity, Unit Value, and Total Value of the inventory valuation. In order to get the valuation report of a particular date, you are allowed to click on the Valuation at Date button where you will get a pop-up to mention the date. After selecting the date, you can click on the Confirm button and Odoo will display the valuation report of that particular date.
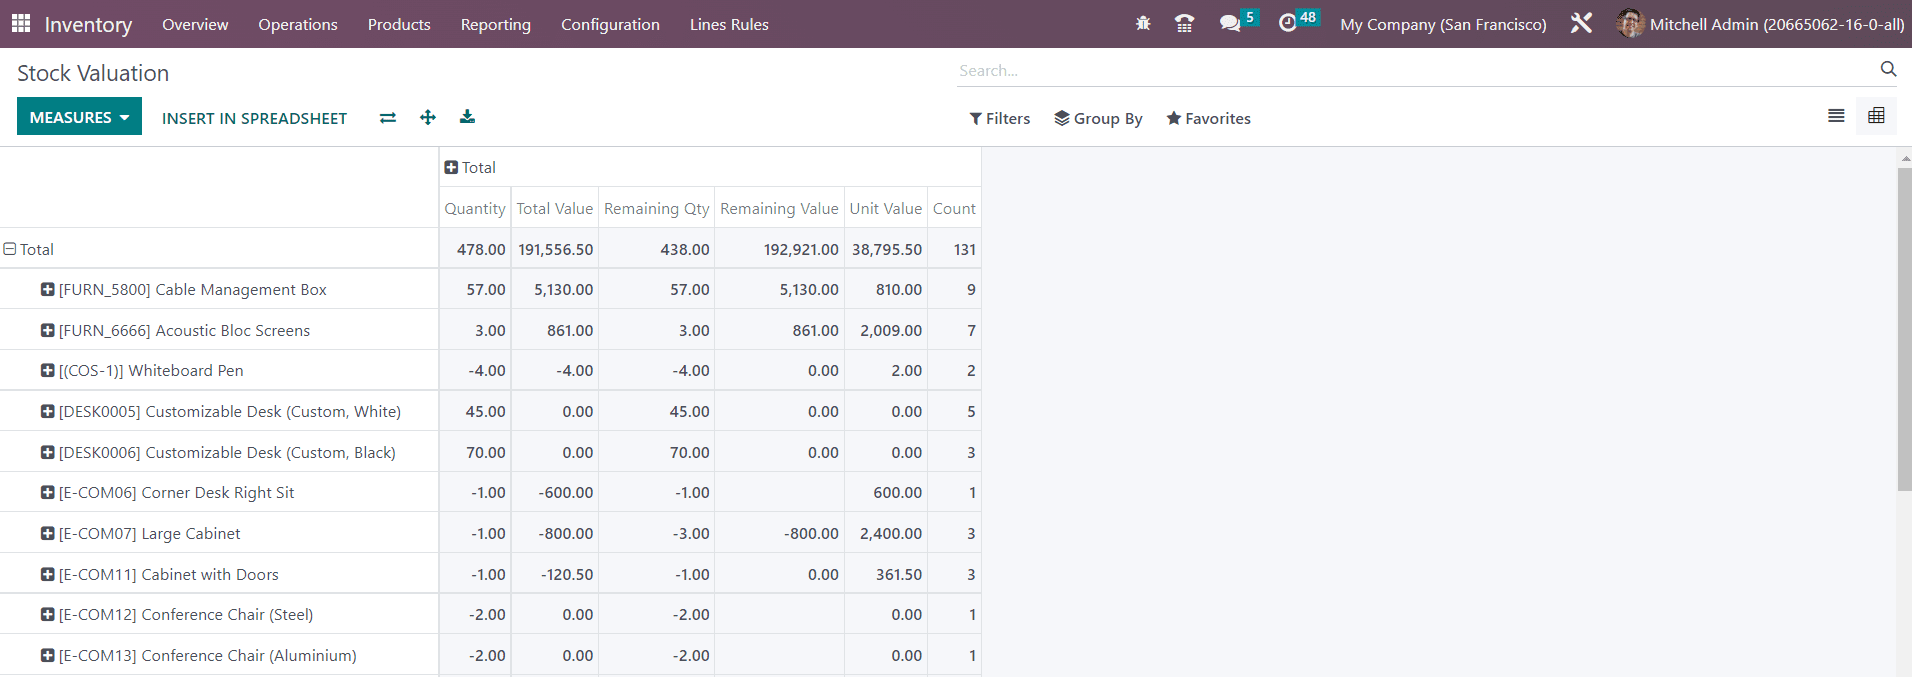
The pivot view of the stock valuation report is given above. You can use Quantity, Remaining Quantity, Remaining Value, Total Value, Unit Value, and Count as Measures for the pivot table. Use the custom features available in the Filters and Group By options to get the expected report of the stock valuation.
Warehouse Analysis
The performance of warehouse operations can be analyzed using the Performance button from the Reporting menu. Odoo will provide useful reports of the warehouse analysis that can be used in the future to enhance performance better than earlier.
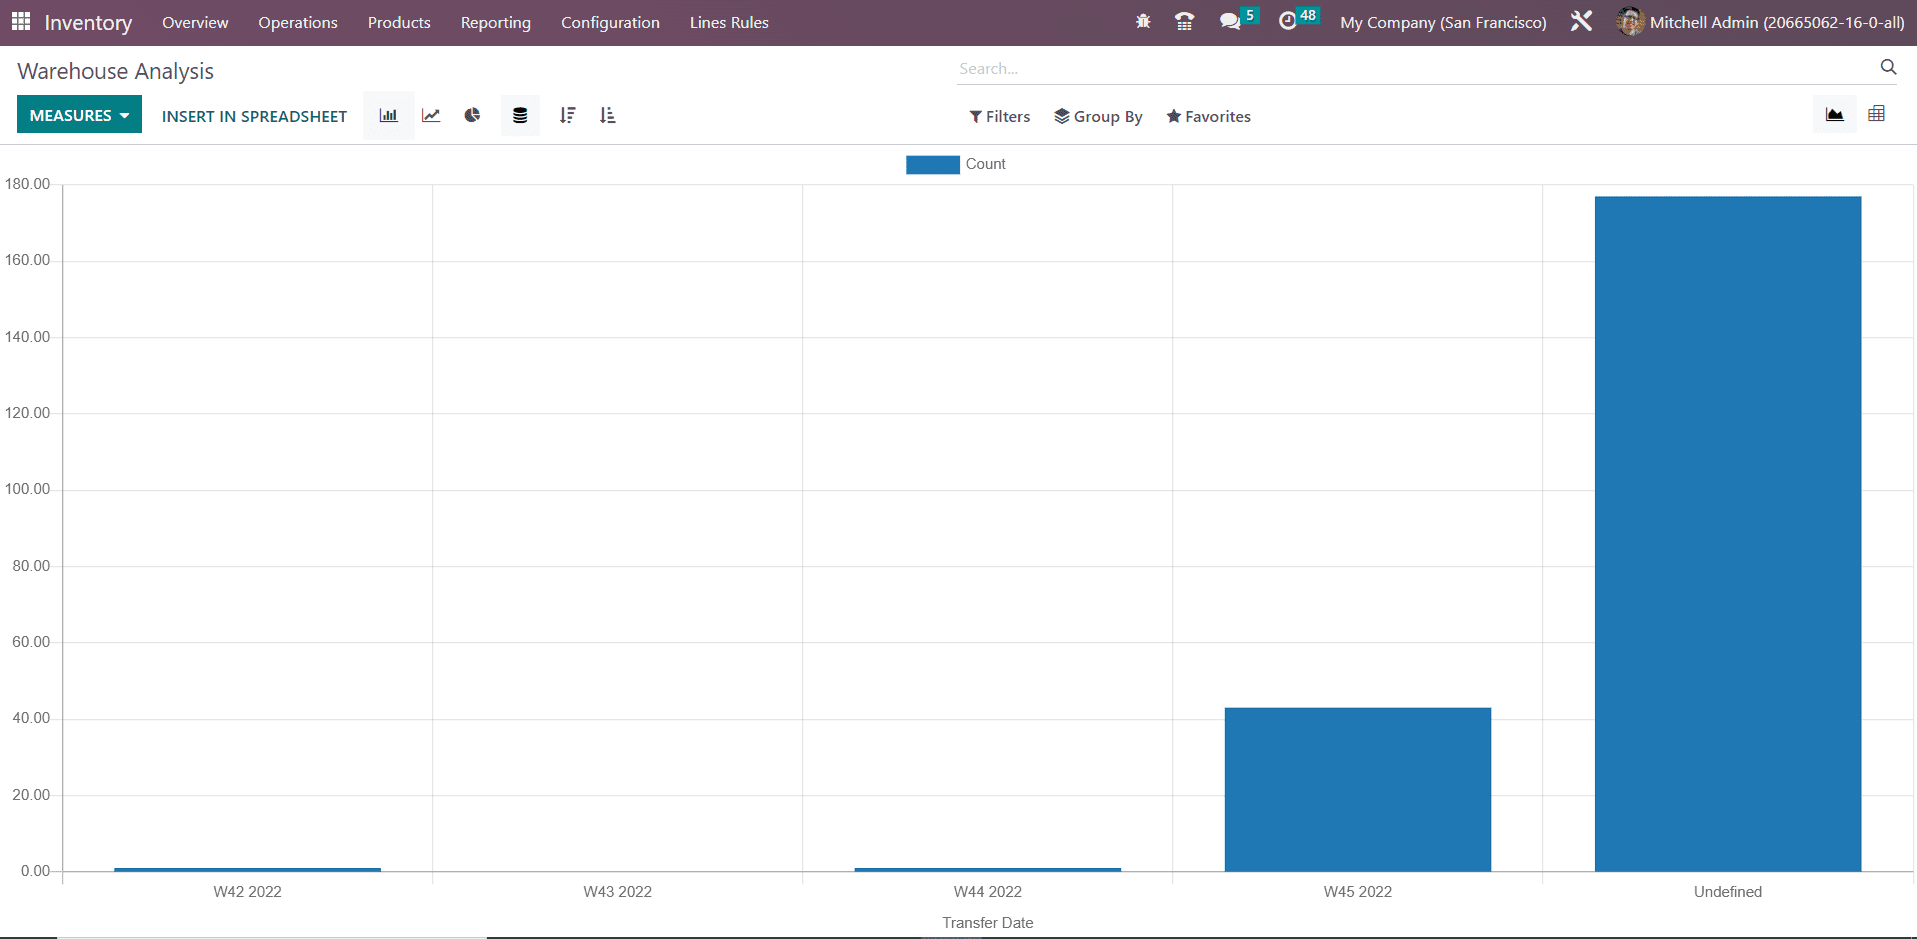
You can observe this platform in Pivot and Graphical views. In the graphical view, you can select Pie, Line, or Bar charts according to the demand. You can change the Measures according to your purpose to get accurate details. You can use Cycle Time, Delay, Product Quantity, and Count as Measures. The report can be filtered based on Done Transfers, Done Deliveries, Done Receipts, and Transfer Date.
Using the dedicated Inventory management system in Odoo, you can organize and monitor all kinds of inventory operations at a single place. For the complete management of your inventory and warehouse operation, you can rely on the highly integrated Inventory module which can assure maximum efficiency in workflow.
Last updated